Mastering Visual Logic: How Flowchart Infographic Diagrams Transform Business Communication
In an era defined by information overload, the ability to distill complex processes into clear, digestible visuals is no longer just a design skill—it is a fundamental business competency. Whether you are onboarding new employees, pitching a strategic pivot to stakeholders, or troubleshooting a technical workflow, text-heavy documents often fail to convey the necessary nuance efficiently. This is where flowchart infographic diagrams emerge as an essential tool for modern communication. By combining the structural logic of traditional flowcharts with the aesthetic engagement of infographics, these visual systems bridge the gap between raw data and human understanding.
This comprehensive guide explores the significance of flowchart infographic diagrams, their practical applications across various sectors, and how utilizing professional-grade assets—such as editable EPS10 files and high-resolution previews—can elevate your presentations and business systems from functional to exceptional.
The Evolution from Standard Flowcharts to Infographic Systems
To understand the value of this specific type of diagram, we must first distinguish it from its predecessors. Traditional flowcharts, born in the mid-20th century, were strictly utilitarian. They used standardized symbols like diamonds for decisions and rectangles for processes to map out algorithms or manufacturing steps. While effective for engineers, they often lacked the visual context required for broader audiences. They told you what happened, but rarely why it mattered or how it felt within the larger ecosystem.
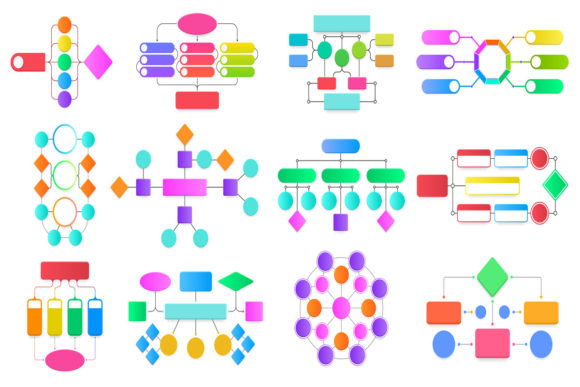
Flowchart infographic diagrams represent the evolution of this concept. They retain the logical connectivity of standard flowcharts but integrate iconography, color coding, typography, and spatial hierarchy. This hybrid approach serves two distinct purposes simultaneously: it maps the sequence of events and communicates the qualitative nature of those events. For example, rather than a simple box labeled "Customer Feedback," an infographic flowchart might utilize a stylized speech bubble icon paired with a sentiment indicator, instantly conveying both the action and its emotional weight.
Why Visual Processing Matters in Professional Settings
The shift toward visual systems is backed by cognitive science. Research consistently shows that humans process visual information significantly faster than text. When we read a paragraph describing a workflow, our brains must perform linear decoding, translating abstract symbols (letters) into concepts before assembling them into a mental model. A well-designed flowchart infographic bypasses much of this translation layer. The spatial arrangement itself acts as the syntax, allowing the viewer to grasp relationships, dependencies, and bottlenecks almost instantaneously.
This efficiency is critical in high-stakes environments. In a boardroom presentation, you may have only seconds to anchor your audience’s attention before diving into details. A polished diagram serves as that anchor, providing a shared mental map that keeps everyone aligned. Without it, discussions often derail as participants struggle to visualize the same process based solely on verbal descriptions.
Practical Applications Across Industries
The versatility of flowchart infographic diagrams makes them applicable far beyond IT departments or manufacturing floors. Their utility spans virtually every domain where processes exist.
- Corporate Training and Onboarding: New hires are often overwhelmed by employee handbooks. Converting organizational structures, approval hierarchies, and compliance protocols into visual flows reduces cognitive load and improves retention. Instead of memorizing a list of rules, employees can trace a path through a decision tree to understand exactly how to handle specific scenarios.
- Marketing and Sales Funnels: Customer journeys are inherently non-linear. Infographic flowcharts allow marketers to map touchpoints across multiple channels, visualizing where leads enter the system, where they drop off, and where conversion opportunities lie. This visual clarity is indispensable for optimizing campaign performance.
- Product Development and UX Design: User experience designers rely heavily on these diagrams to map user flows and interaction states. Before a single line of code is written, teams use these visuals to identify friction points in navigation or logic gaps in feature sets. The infographic element helps stakeholders who lack technical backgrounds understand the user's emotional journey alongside the functional steps.
- Project Management: While Gantt charts handle timelines, flowchart infographics excel at mapping dependencies and resource allocation. They help teams visualize critical paths and understand how delays in one area cascade through the entire project ecosystem.
Technical Excellence: Understanding File Formats and Resolution
When implementing these diagrams in professional settings, the quality of your source material dictates the flexibility of your output. Many users mistakenly believe that any image found online will suffice, leading to pixelated presentations or uneditable graphics that cannot be adapted to specific brand guidelines. Understanding the technical specifications of professional assets is crucial for long-term utility.
The Importance of Vector Graphics (EPS10)
Professional flowchart infographic products typically include an EPS10 file. EPS (Encapsulated PostScript) is a vector-based format, which is fundamentally different from raster images like JPEGs or PNGs. Vector graphics are defined by mathematical equations rather than pixels. This means you can scale an EPS10 flowchart to the size of a postage stamp or a billboard without losing a single ounce of clarity.
More importantly for business users, EPS10 files are fully editable in industry-standard software like Adobe Illustrator or CorelDRAW. This editability is what transforms a generic template into a bespoke business asset. You can change colors to match your corporate identity, swap icons to reflect your specific industry, adjust text labels, and rearrange nodes to fit your unique workflow. Without a vector source file, you are locked into someone else’s design; with it, you possess a flexible system that grows with your organization.
The Role of Preview Files
The inclusion of a 72ppi Resolution JPEG serves a specific purpose in the workflow. At 72 pixels per inch, this file is optimized for screen viewing, not print. It acts as a lightweight reference, allowing you to quickly assess the layout, style, and content structure without opening heavy vector software. It is perfect for sharing via email, embedding in internal wikis, or using as a placeholder during the drafting phase of a presentation. However, for final deliverables—especially printed reports or high-definition displays—you should always revert to the EPS10 source to ensure crisp, professional rendering.
Common Misunderstandings About Visual Workflows
Despite their benefits, flowchart infographic diagrams are sometimes misused or misunderstood. Addressing these misconceptions ensures you get the most value from your visual assets.
Misconception 1: Complexity Equals Comprehensiveness. There is a tendency to cram every possible detail into a single diagram. However, the goal of an infographic flowchart is clarity, not exhaustiveness. If a diagram requires ten minutes of explanation to decode, it has failed as a visual aid. Effective diagrams focus on the primary narrative, relegating edge cases and granular details to supplementary documentation.
Misconception 2: Aesthetics Are Secondary to Function. Some professionals view design elements as mere decoration. In reality, aesthetics serve a functional role in information architecture. Color differentiation guides the eye through parallel processes. Iconography creates instant recognition anchors. Whitespace prevents cognitive fatigue. Neglecting the "infographic" aspect of the flowchart undermines its effectiveness as a communication tool.
Misconception 3: One Size Fits All. A flowchart designed for software architecture will not work for HR policy. This is why customizable EPS10 assets are superior to static images. You must adapt the visual language to your audience’s literacy level and contextual knowledge. What is intuitive to a developer may be opaque to a marketing manager, and vice versa.
Integrating Flowcharts into Modern Digital Ecosystems
As remote work and digital collaboration become the norm, flowchart infographic diagrams have taken on new significance. They serve as asynchronous communication artifacts that reduce the need for synchronous meetings. A well-documented visual workflow posted in a team workspace can answer questions that would otherwise require a thirty-minute call.
Furthermore, these diagrams integrate seamlessly with modern presentation software and documentation platforms. Because they are scalable vectors, they maintain fidelity whether viewed on a mobile device during a commute or projected onto a 4K conference room screen. This responsiveness ensures that your message remains consistent across all mediums, reinforcing brand professionalism and operational clarity.
Building a Broader Understanding Through Visual Systems
Ultimately, adopting flowchart infographic diagrams is about more than just making prettier slides. It is about cultivating a culture of clarity and systematic thinking. When teams commit to visualizing their processes, they are forced to confront ambiguities and inefficiencies that text allows them to gloss over. You cannot draw a connection that doesn’t exist; you cannot illustrate a step that hasn’t been defined.
By investing in high-quality, editable resources containing both EPS10 vector files and accessible preview images, organizations equip themselves with a sustainable framework for visual communication. These tools transform abstract ideas into tangible assets, facilitating better decision-making, smoother onboarding, and more effective storytelling. In a world where attention is the scarcest resource, the ability to communicate complex systems simply and beautifully is not just an advantage—it is a necessity for sustained success.